Bat Changes and Scoring Trends
June 14, 2014
Scoring averages are probably the most stable metric in division one team sports. Yearly deviations can always (for at least as
long as I've been measuring them) be explained by changes in scoring (adding the 3-point shot in basketball), rules (clock management
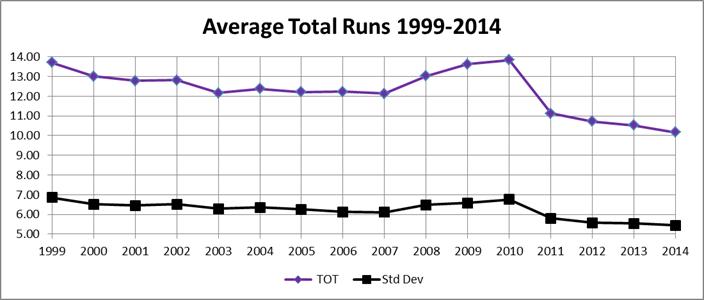
in football) or for baseball, equipment. It's not hard to spot changes in bat specifications from the graph of average runs per game
in the super-reginal era:
D1 Scoring 1999-2014
| Year | RS Games | WS | Std Dev | | LS | Std Dev | — | MOV | Std Dev | | TOT | Std Dev | — | aSOV | Std Dev |
| 1999 | 7792 | 9.42 | 4.81 | | 4.29 | 3.14 | | 5.13 | 4.36 | | 13.71 | 6.85 | | 0.4062 | 0.2811 |
| 2000 | 7894 | 9.04 | 4.67 | | 3.97 | 2.94 | | 5.08 | 4.28 | | 13.01 | 6.52 | | 0.4183 | 0.2817 |
| 2001 | 7896 | 8.90 | 4.56 | | 3.88 | 2.92 | | 5.03 | 4.11 | | 12.78 | 6.45 | | 0.4269 | 0.2832 |
| 2002 | 7981 | 8.93 | 4.66 | | 3.89 | 2.93 | | 5.04 | 4.25 | | 12.82 | 6.52 | | 0.4260 | 0.2859 |
| 2003 | 7775 | 8.51 | 4.50 | | 3.65 | 2.80 | | 4.86 | 4.07 | | 12.16 | 6.29 | | 0.4331 | 0.2865 |
| 2004 | 7999 | 8.63 | 4.50 | | 3.74 | 2.86 | | 4.89 | 4.06 | | 12.37 | 6.35 | | 0.4313 | 0.2872 |
| 2005 | 7988 | 8.56 | 4.50 | | 3.65 | 2.80 | | 4.91 | 4.12 | | 12.21 | 6.26 | | 0.4357 | 0.2899 |
| 2006 | 8158 | 8.51 | 4.35 | | 3.72 | 2.75 | | 4.78 | 3.95 | | 12.23 | 6.12 | | 0.4256 | 0.2869 |
| 2007 | 8138 | 8.43 | 4.33 | | 3.70 | 2.77 | | 4.74 | 3.94 | | 12.13 | 6.11 | | 0.4237 | 0.2842 |
| 2008 | 8237 | 8.99 | 4.53 | | 4.04 | 2.94 | | 4.96 | 4.04 | | 13.03 | 6.48 | | 0.4124 | 0.2752 |
| 2009 | 8140 | 9.34 | 4.64 | | 4.29 | 2.99 | | 5.05 | 4.20 | | 13.63 | 6.57 | | 0.3983 | 0.2707 |
| 2010 | 8381 | 9.48 | 4.74 | | 4.34 | 3.08 | | 5.14 | 4.27 | | 13.83 | 6.76 | | 0.4000 | 0.2740 |
| 2011 | 8261 | 7.80 | 4.07 | | 3.33 | 2.62 | | 4.47 | 3.64 | | 11.13 | 5.80 | | 0.4407 | 0.2919 |
| 2012 | 8289 | 7.52 | 3.97 | | 3.20 | 2.46 | | 4.32 | 3.55 | | 10.72 | 5.57 | | 0.4414 | 0.2892 |
| 2013 | 8271 | 7.39 | 3.93 | | 3.13 | 2.46 | | 4.26 | 3.51 | | 10.52 | 5.54 | | 0.4460 | 0.2920 |
| 2014 | 8190 | 7.15 | 3.85 | | 3.01 | 2.42 | | 4.14 | 3.43 | | 10.16 | 5.44 | | 0.4523 | 0.2967 |
|
| Data Source: The College Baseball Game Score Database at
Boydsworld.com |
It's easier to see in a graph:
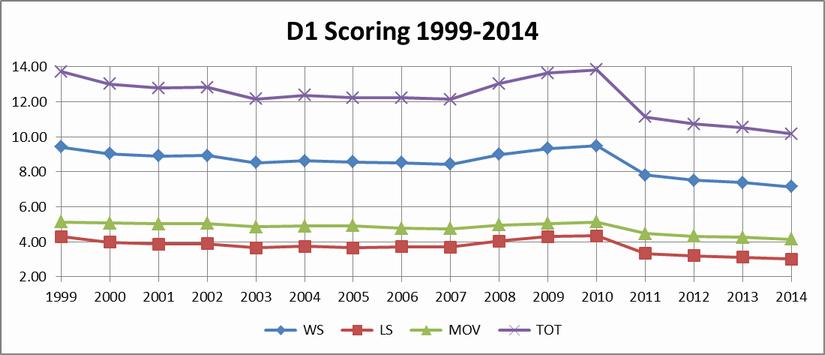
There actually wasn't a specification change between 2007 and 2008. Teams just began using "bouncier" bats that did meet the specification,
leading to the BBCOR bats that couldn't be made "bouncy" required after 2010 looked too much like 1999.
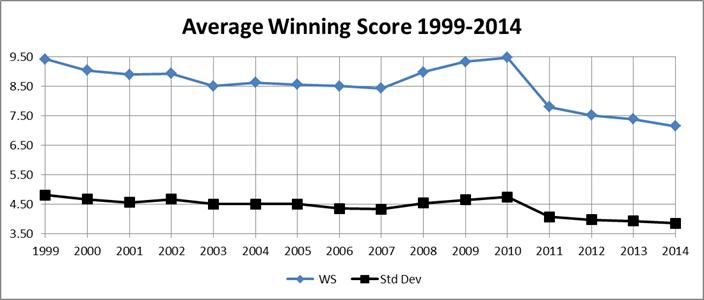
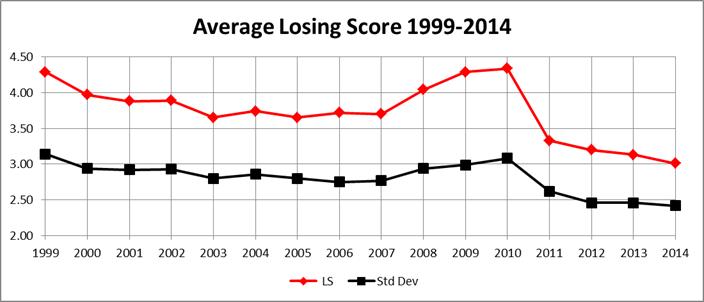
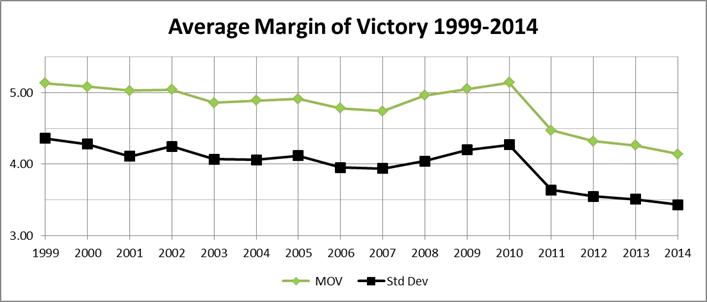
Graphing the components individually:
Parity in our lifetime?
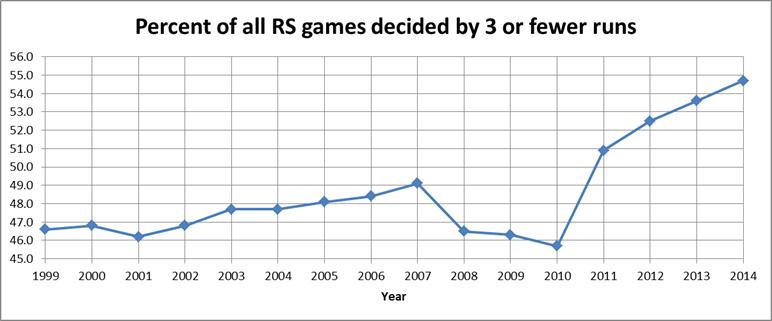
Here's the breakdown by year for margin of victory as percentage of all games:
| Percentage of Games |
| MOV | 1999 | 2000 | 2001 | 2002 | 2003 | 2004 | 2005 | 2006 | 2007 | 2008 | 2009 | 2010 | 2011 | 2012 | 2013 | 2014 |
| 1 | 22.5 | 21.9 | 22.2 | 21.4 | 22.5 | 22.8 | 22.5 | 22.6 | 23.3 | 21.8 | 21.2 | 21.9 | 24.2 | 25.4 | 25.4 | 26.8 |
| 2 | 12.6 | 13.3 | 12.6 | 14.5 | 13.9 | 13.5 | 13.8 | 14.4 | 14.4 | 13.1 | 13.6 | 12.9 | 14.1 | 14.6 | 15.4 | 15.3 |
| 3 | 11.5 | 11.6 | 11.4 | 10.9 | 11.3 | 11.4 | 11.8 | 11.4 | 11.4 | 11.6 | 11.5 | 10.9 | 12.6 | 12.5 | 12.8 | 12.6 |
| 4 | 9.1 | 9.6 | 10.0 | 10.1 | 10.5 | 9.8 | 9.8 | 9.8 | 9.5 | 9.7 | 9.9 | 9.2 | 10.5 | 10.1 | 9.8 | 10.4 |
| 5 | 8.0 | 7.8 | 7.4 | 8.0 | 8.4 | 8.2 | 7.7 | 8.6 | 8.3 | 8.1 | 8.0 | 8.1 | 8.4 | 8.6 | 8.5 | 7.7 |
| 6 | 6.9 | 6.7 | 7.2 | 6.3 | 6.8 | 6.7 | 7.0 | 7.1 | 6.8 | 7.3 | 6.8 | 7.3 | 6.5 | 6.8 | 6.4 | 6.5 |
| 7 | 5.7 | 6.2 | 5.9 | 5.7 | 5.4 | 5.8 | 5.3 | 5.6 | 5.9 | 6.1 | 5.8 | 6.2 | 5.6 | 5.3 | 5.3 | 5.0 |
| 8 | 4.9 | 4.8 | 4.9 | 4.9 | 4.4 | 4.5 | 4.9 | 4.5 | 4.5 | 4.6 | 4.6 | 4.5 | 4.0 | 4.1 | 4.1 | 4.2 |
| 9 | 4.2 | 3.4 | 4.2 | 3.8 | 3.3 | 3.8 | 3.5 | 3.0 | 3.6 | 4.2 | 4.0 | 3.7 | 3.3 | 3.2 | 3.1 | 2.7 |
| 10 | 3.1 | 3.3 | 3.8 | 3.7 | 3.6 | 3.5 | 3.6 | 3.4 | 3.0 | 3.8 | 4.0 | 4.0 | 3.2 | 2.8 | 2.8 | 2.9 |
| 11 | 2.2 | 2.4 | 2.6 | 2.3 | 2.5 | 2.4 | 2.6 | 2.6 | 2.3 | 2.6 | 2.6 | 2.6 | 2.2 | 1.9 | 1.8 | 1.7 |
| 12 | 2.5 | 2.3 | 2.0 | 2.0 | 1.8 | 2.1 | 1.6 | 1.9 | 2.0 | 1.6 | 1.9 | 2.1 | 1.7 | 1.4 | 1.4 | 1.3 |
| 13 | 1.8 | 1.5 | 1.5 | 1.5 | 1.4 | 1.3 | 1.4 | 1.3 | 1.3 | 1.2 | 1.5 | 1.4 | 1.1 | 0.9 | 0.9 | 0.9 |
| 14 | 1.1 | 1.4 | 1.1 | 1.1 | 1.0 | 1.3 | 1.1 | 1.2 | 1.0 | 0.9 | 1.1 | 1.3 | 0.7 | 0.6 | 0.7 | 0.5 |
| 15 | 0.8 | 1.0 | 0.8 | 0.9 | 0.8 | 0.7 | 0.7 | 0.7 | 0.7 | 0.8 | 0.8 | 1.0 | 0.5 | 0.5 | 0.5 | 0.5 |
| 16 | 0.7 | 0.8 | 0.5 | 0.7 | 0.7 | 0.7 | 0.7 | 0.6 | 0.6 | 0.6 | 0.7 | 0.7 | 0.4 | 0.4 | 0.3 | 0.4 |
| 17 | 0.4 | 0.4 | 0.5 | 0.5 | 0.3 | 0.5 | 0.5 | 0.5 | 0.3 | 0.5 | 0.4 | 0.6 | 0.2 | 0.3 | 0.2 | 0.2 |
| 18 | 0.4 | 0.4 | 0.4 | 0.5 | 0.3 | 0.4 | 0.4 | 0.3 | 0.3 | 0.4 | 0.3 | 0.4 | 0.2 | 0.2 | 0.2 | 0.1 |
| 19 | 0.3 | 0.3 | 0.3 | 0.4 | 0.3 | 0.2 | 0.3 | 0.2 | 0.2 | 0.3 | 0.3 | 0.3 | 0.1 | 0.2 | 0.1 | 0.1 |
| 20 | 0.3 | 0.3 | 0.1 | 0.2 | 0.2 | 0.2 | 0.3 | 0.2 | 0.1 | 0.1 | 0.3 | 0.2 | 0.2 | 0.1 | 0.1 | 0.1 |
| 21 | 0.2 | 0.1 | 0.1 | 0.2 | 0.1 | 0.1 | 0.1 | 0.1 | 0.1 | 0.1 | 0.2 | 0.1 | 0.1 | <.05 | 0.1 | <.05 |
| 22 | 0.1 | 0.1 | 0.1 | 0.2 | 0.1 | 0.1 | 0.1 | 0.1 | <.05 | 0.1 | <.05 | 0.2 | 0 | <.05 | <.05 | <.05 |
| 23 | 0.1 | 0.1 | <.05 | 0.1 | 0.1 | <.05 | 0.1 | <.05 | 0.1 | 0.1 | 0.1 | 0.2 | <.05 | <.05 | <.05 | <.05 |
| 24 | 0.1 | 0.1 | 0.1 | 0.1 | 0.1 | 0.1 | <.05 | <.05 | <.05 | 0.1 | 0.1 | 0.1 | <.05 | 0 | 0 | <.05 |
| 25 | 0.1 | 0.1 | <.05 | <.05 | 0.1 | <.05 | <.05 | 0.1 | <.05 | <.05 | 0.1 | <.05 | 0 | <.05 | <.05 | 0 |
| MOV | 1999 | 2000 | 2001 | 2002 | 2003 | 2004 | 2005 | 2006 | 2007 | 2008 | 2009 | 2010 | 2011 | 2012 | 2013 | 2014 |
| 26 | 0.1 | 0.1 | <.05 | 0.1 | 0.1 | <.05 | <.05 | <.05 | <.05 | <.05 | <.05 | 0.1 | 0 | <.05 | <.05 | 0 |
| 27 | 0.1 | <.05 | 0.1 | 0 | 0 | <.05 | <.05 | 0 | 0.1 | <.05 | <.05 | <.05 | 0 | <.05 | <.05 | <.05 |
| 28 | <.05 | <.05 | <.05 | <.05 | <.05 | 0.1 | <.05 | <.05 | 0 | <.05 | <.05 | <.05 | <.05 | <.05 | 0 | 0 |
| 29 | <.05 | <.05 | 0 | <.05 | <.05 | 0 | <.05 | 0 | 0 | <.05 | 0 | <.05 | 0 | 0 | 0 | 0 |
| 30 | <.05 | <.05 | 0 | <.05 | <.05 | 0 | <.05 | 0 | <.05 | 0 | <.05 | 0 | <.05 | 0 | <.05 | <.05 |
| 31 | 0 | 0 | <.05 | <.05 | 0 | 0 | <.05 | 0 | <.05 | 0 | 0 | 0 | 0 | 0 | 0 | 0 |
| 32 | 0 | <.05 | <.05 | 0 | 0 | 0 | 0 | 0 | 0 | 0 | 0 | <.05 | 0 | 0 | 0 | 0 |
| 33 | 0 | <.05 | 0 | 0 | 0 | 0 | 0 | <.05 | <.05 | <.05 | <.05 | 0 | 0 | 0 | 0 | 0 |
| 34 | <.05 | 0 | <.05 | 0 | 0 | 0 | 0 | <.05 | 0 | 0 | 0 | 0 | 0 | 0 | 0 | 0 |
| 35 | 0 | <.05 | 0 | 0 | 0 | 0 | 0 | 0 | 0 | 0 | 0 | 0 | 0 | 0 | 0 | 0 |
| 38 | 0 | 0 | 0 | 0 | 0 | <.05 | 0 | 0 | 0 | 0 | 0 | 0 | 0 | 0 | 0 | 0 |
| 47 | <.05 | 0 | 0 | 0 | 0 | 0 | 0 | 0 | 0 | 0 | 0 | 0 | 0 | 0 | 0 | 0 |
| 48 | 0 | 0 | 0 | 0 | 0 | 0 | 0 | 0 | 0 | 0 | <.05 | 0 | 0 | 0 | 0 | 0 |
|
In memory of

Paul Kislanko


