Post-Season Scoring in the 64-team Era
June 12, 2015
It's pretty easy to spot the points in the 64-team era history where the equipment changes impacted average post-season scores, except for the CWS because the effect of the BBCOR bats was magnified by the move to Ameritrade Park. It'll be interesting to see how that empty column for 2015 is filled in when the new ball takes on the new park.
Post-Season Scoring History 1999-Present
| 1999 | 2000 | 2001 | 2002 | 2003 | 2004 | 2005 | 2006 | 2007 | 2008 | 2009 | 2010 | 2011 | 2012 | 2013 | 2014 | 2015 |
| Reg #Gms | 104 | 103 | 104 | 102 | 101 | 101 | 100 | 100 | 101 | 102 | 102 | 104 | 101 | 101 | 100 | 103 | 101 |
| Reg WS | 10.05 | 8.87 | 9.23 | 8.33 | 9.03 | 8.16 | 8.56 | 8.56 | 8.10 | 9.52 | 9.61 | 9.72 | 7.46 | 7.53 | 6.83 | 6.23 | 6.68 |
| Reg LS | 4.62 | 3.71 | 4.53 | 3.69 | 3.82 | 3.16 | 3.38 | 3.82 | 3.78 | 4.04 | 4.08 | 4.20 | 2.57 | 2.96 | 2.78 | 2.33 | 2.52 |
| Reg TR | 14.66 | 12.58 | 13.76 | 12.02 | 12.85 | 11.32 | 11.94 | 12.38 | 11.88 | 13.56 | 13.69 | 13.92 | 10.03 | 10.50 | 9.61 | 8.56 | 9.21 |
| Reg MoV | 5.43 | 5.17 | 4.70 | 4.65 | 5.21 | 5.00 | 5.18 | 4.74 | 4.32 | 5.48 | 5.53 | 5.52 | 4.88 | 4.57 | 4.05 | 3.90 | 4.16 |
| |
| 1999 | 2000 | 2001 | 2002 | 2003 | 2004 | 2005 | 2006 | 2007 | 2008 | 2009 | 2010 | 2011 | 2012 | 2013 | 2014 | 2015 |
| SR #Gms | 20 | 20 | 19 | 21 | 19 | 17 | 21 | 19 | 18 | 21 | 18 | 21 | 20 | 19 | 18 | 20 | 19 |
| SR WS | 10.30 | 7.10 | 8.26 | 7.43 | 8.32 | 7.12 | 6.90 | 9.84 | 6.67 | 10.48 | 7.61 | 7.67 | 7.40 | 6.68 | 6.44 | 5.90 | 7.05 |
| SR LS | 3.90 | 2.70 | 3.63 | 3.10 | 3.84 | 3.53 | 3.38 | 4.32 | 2.56 | 5.43 | 3.44 | 3.90 | 2.45 | 2.79 | 3.28 | 2.85 | 2.79 |
| SR TR | 14.20 | 9.80 | 11.89 | 10.52 | 12.16 | 10.65 | 10.29 | 14.16 | 9.22 | 15.90 | 11.06 | 11.57 | 9.85 | 9.47 | 9.72 | 8.75 | 9.84 |
| SR MoV | 6.40 | 4.40 | 4.63 | 4.33 | 4.47 | 3.59 | 3.52 | 5.53 | 4.11 | 5.05 | 4.17 | 3.76 | 4.95 | 3.89 | 3.17 | 3.05 | 4.26 |
| |
| 1999 | 2000 | 2001 | 2002 | 2003 | 2004 | 2005 | 2006 | 2007 | 2008 | 2009 | 2010 | 2011 | 2012 | 2013 | 2014 | 2015 |
| CWS #Gms | 14 | 13 | 13 | 14 | 16 | 15 | 15 | 16 | 15 | 16 | 15 | 16 | 14 | 15 | 14 | 17 | 0 |
| CWS WS | 7.86 | 8.15 | 10.23 | 8.14 | 8.13 | 7.47 | 5.40 | 5.94 | 8.33 | 8.56 | 8.33 | 6.75 | 5.21 | 5.53 | 4.71 | 4.12 |
| CWS LS | 3.86 | 4.23 | 5.15 | 4.57 | 3.44 | 3.53 | 2.87 | 3.00 | 4.00 | 4.31 | 4.13 | 2.88 | 2.00 | 1.60 | 1.43 | 2.12 |
| CWS TR | 11.71 | 12.38 | 15.38 | 12.71 | 11.56 | 11.00 | 8.27 | 8.94 | 12.33 | 12.88 | 12.47 | 9.63 | 7.21 | 7.13 | 6.14 | 6.24 |
| CWS MoV | 4.00 | 3.92 | 5.08 | 3.57 | 4.69 | 3.93 | 2.53 | 2.94 | 4.33 | 4.25 | 4.20 | 3.88 | 3.21 | 3.93 | 3.29 | 2.00 |
| |
| 1999 | 2000 | 2001 | 2002 | 2003 | 2004 | 2005 | 2006 | 2007 | 2008 | 2009 | 2010 | 2011 | 2012 | 2013 | 2014 | 2015 |
| All #Gms | 138 | 136 | 136 | 137 | 136 | 133 | 136 | 135 | 134 | 139 | 135 | 141 | 135 | 135 | 132 | 140 | 120 |
| All WS | 9.86 | 8.54 | 9.19 | 8.18 | 8.82 | 7.95 | 7.96 | 8.43 | 7.93 | 9.55 | 9.20 | 9.08 | 7.21 | 7.19 | 6.55 | 5.93 | 6.74 |
| All LS | 4.43 | 3.61 | 4.46 | 3.69 | 3.78 | 3.25 | 3.32 | 3.79 | 3.64 | 4.28 | 4.00 | 4.01 | 2.50 | 2.79 | 2.70 | 2.38 | 2.57 |
| All TR | 14.30 | 12.15 | 13.65 | 11.86 | 12.60 | 11.20 | 11.28 | 12.22 | 11.57 | 13.83 | 13.20 | 13.09 | 9.71 | 9.98 | 9.26 | 8.31 | 9.31 |
| All MoV | 5.43 | 4.93 | 4.73 | 4.49 | 5.04 | 4.70 | 4.63 | 4.64 | 4.29 | 5.27 | 5.20 | 5.07 | 4.72 | 4.41 | 3.85 | 3.55 | 4.17 |
|
OK, it's easier to see when the highlighted lines are displayed in a graph.
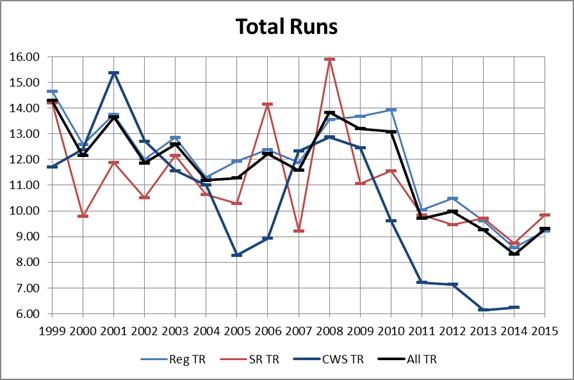
Total runs doesn't tell the whole story - it is worth investigating how competitive the games have been. We can judge that by comparing the average winning and losing runs-scored and their difference (MoV) from year to year.
I think we can safely call 2008-2010 the "rolled bat" era, since there were no specification changes from the prior four seasons. Note that whenever the MoV curve falls between the winning-runs and losing-runs curves the winning team averaged scoring more than twice as many runs as the losing team averaged.
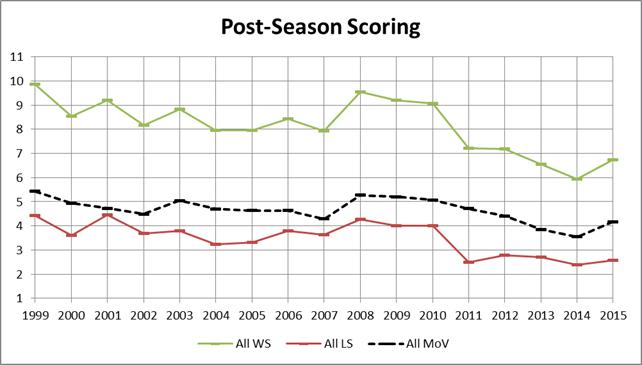
Conventional wisdom suggests that as the tournament progresses teams should be more nearly equal so MoV should be lower in the Super-Regionals than the Regionals, and lowest in the CWS.
 It's no surprise this graph looks a lot like the previous one - 70 or so per cent of the post-season as measured in games played consists of the first round.
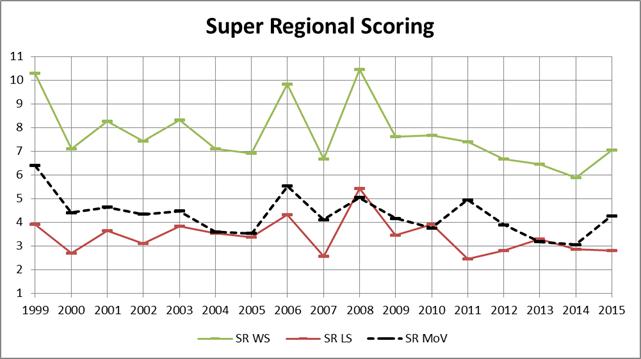 It should be noted that each year only includes 17-21 samples, so it only takes a few blowout wins to skew the averages, and those can happen even at this level of competition. Interesting coincidence(?) how much 2013-2014 looks like 2004-2005.
Now to the College World Series. Using the Super-Regional data as a kind of "control" that accounts for changes in bats and balls (conveniently ignoring park factors that surely played some role in the SR numbers) we can observe the "AmeriTrade effect."
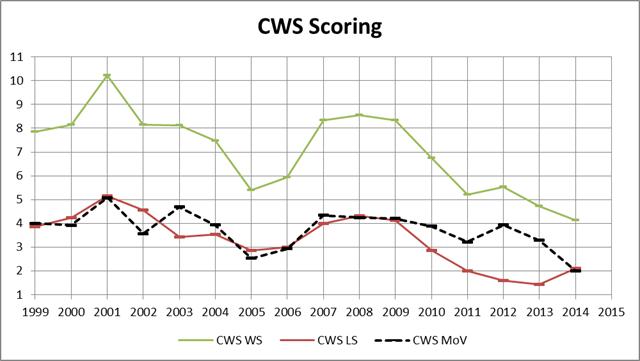 Interesting that the least competitive AmeriTrade CWS by average margin of victory was 2012. That was almost identical to the average MoV for the last Rosenblatt CWS. And 2014's was the most tightly-contested CWS in the 64-team era, closer than the 2005 series.
© Copyright 2015 Paul Kislanko