The main purpose is to demonstrate the differences between the computer algorithms. To compare ordered lists I use the notion of "distance" - the number of team-pairs that are in opposite relative order in the two lists. With the 299-team field there are 44,551 team-pairs and for algorithms that generate identical lists distance will be zero.
With all the ranking data available it is also possible to analyze alternate definitions of composite rankings. Dr. Massey's list is ordered by a "consensus" rank
The "average" or "consensus" ranking for each team is determined using a least squares fit based on paired comparisons between teams for each of the listed ranking systems. If a team is ranked by all systems, the consensus is equal to the arithmetic average ranking. When a team is not ranked by a particular system, its consensus will be lowered accordingly.and the presentation of rankings is in decreasing correlation to that consensus.
In this analysis I do mostly the same thing adding three additional definitions of "consensus" using ranked-ballot voting methods:
I also report the geometric mean of the computer rankings just for interest, but I do not include it in any of the correlations.
Borda Define the "Borda Count" for each team as the number of teams ranked worse than the given team. Order the teams in decreasing ∑(Borda Count) over all computer ratings. The Borda rank is the same as a ranking by the aritmetic mean of the computer rankings. It would be identical with Dr. Massey's consensus rank (which I denote by MComp) were the latter to not include the human polls that don't raank all teams.)
Cond The Condorcet ranking defines a "pairwise win" of team A over team B if a majority of ratings have A ranked better than B, a "pairwise loss" if a majority of ratings have A ranked worse than B. If there are an even number of ratings there could be "pairwise ties." Order the teams by decreasing pairwise winning percentage to assign ranks.
BMaj The Bucklin Majority is the best ranking for which more than half of the ratings have the team ranked at least that high. If there are an odd number of ratings this is identically the arithmetic median of the team's ranks. For an even number of ratings, it is the best rank worse than the arithmetic median. This is my preferred "generic" composite rank. As Dr. Massey wrote about the median this "has the advantage of being less influenced by outlier rankings." To be more precise, an "outlier" on the better side of this rank counts the same as at least half of the ratings, and an outlier on the worse side contributes nothing.
To determine the report sequence I find the cumulative distances between the composites and the computer ratings, and choose the composite with the least. For the rankings compiled Sat Mar 30 12:38:23 2019 that chooses the Condorcet rank, and the computer ratings are ordered the same as they are using the consensus used on the Ranking Composite page.
A related rank-based correlation to the one I chose is just to calculate the number of team-pairs that are in the same relative order in both lists divided by the total number of team-pairs. The result is a value between 0 and 1, shown in this table without the "0." for correlations between the composite and computer-based rankings.
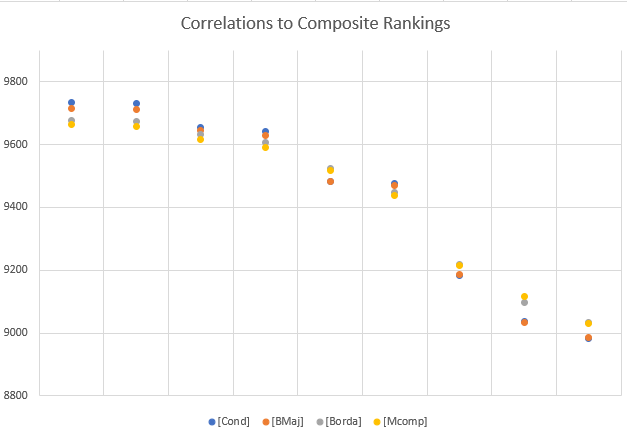
It is easier to see how the computer rankings can be categorized from a graph of the correlation to composite for { MAS KLK DII ISR RT MGS MOR NOL RPI }
BMaj Borda Mcomp MAS KLK DII ISR RT MGS MOR NOL RPI Cond 9885 9867 9848 9733 9732 9654 9641 9484 9477 9184 9036 8983 BMaj 9847 9830 9715 9713 9644 9628 9483 9470 9187 9035 8987 Borda 9974 9678 9675 9633 9607 9525 9448 9217 9098 9034 Mcomp 9664 9657 9617 9590 9518 9437 9216 9115 9029 MAS 9616 9579 9583 9370 9409 9045 9017 8904 KLK 9601 9567 9369 9421 9125 8900 8918 DII 9474 9343 9313 9177 8863 8928 ISR 9240 9429 8981 8912 9004 RT 9156 9226 9072 8820 MGS 9003 8794 8825 MOR 8747 8465 NOL 8546
The first four ratings { MAS KLK DII ISR } form a group that conforms to the composites for at least 95.70 per cent of all team pairs, and to each other by 94.74 per cent or better. The next two { RT MGS } fall into the range 94.37 to 95.25 per cent conformance to composites and to each other for 91.56 per cent. The third group { MOR NOL RPI } conform to the composites anywhere from 89.83 to 92.17 per cent and to each other only 84.65 per cent to 87.47 per cent.
The rankings that are least like the consensus are least like each other, so we can't conclude that they are similar algorithms. It's a good bet, though, that the ratings in the first group weigh the same inputs very much the same way.
I'll report the extra "composite" rankings as Computer Ranking Composites including a table of distances between rankings after the report by team.
© Copyright 2019 Paul Kislanko